How to Trade Gold in 2026
Institutional Asset
Gold (XAU/USD) hit an all-time intraday high of $5,595.47 on 29 January 2026 — its most dramatic single-quarter move in two decades. By mid-2026, the metal had pulled back to the $4,000–$4,500 range as geopolitical risk eased and the US dollar recovered, but remains approximately 34% higher year-on-year according to data from the World Gold Council. For retail CFD traders, gold represents one of the most liquid, most data-driven, and most technically consistent instruments available. It also carries some of the most widely misunderstood risks. This guide covers everything you need to trade XAU/USD intelligently in 2026 — from the macroeconomic drivers that move the price to verified broker spread data, technical analysis levels, and institutional-grade risk management rules.
Written By
ForexRater Research Team
Data-driven broker comparison · Independently tested · No paid rankings
Reviewed against our published methodology →Reviews represent the editorial opinion of ForexRater and are not personal financial advice.
Key Takeaways: What Every Gold Trader Needs to Know in 2026
Gold (XAU/USD) reached an all-time intraday high of $5,595.47 on 29 January 2026, driven by central bank accumulation, a weakening US Dollar, and safe-haven demand. It subsequently corrected more than 28% to below $4,000 by mid-year — demonstrating that even the strongest gold rallies carry significant drawdown risk.
Global central banks purchased 863 tonnes of gold in 2025 according to the World Gold Council — nearly double the 2010–2021 annual average of 473 tonnes. China, Poland, and Kazakhstan were among the largest buyers. This structural demand provides a fundamental floor but does not eliminate short-term volatility.
Verified XAU/USD spreads in 2026 range from $0.03 (IC Markets Raw Trader account) to $0.45 (standard retail accounts) per ounce — a difference that compounds significantly for active traders executing multiple positions per day.
Maximum retail leverage on gold CFDs is 1:20 under FCA (UK), ASIC (Australia), and CySEC (EU) regulation. At 1:20 leverage, a 5% adverse gold move produces a 100% loss of deposited margin.
The best time to trade XAU/USD is 13:00–18:00 GMT — the COMEX futures session overlap with the London afternoon — when institutional liquidity is deepest and spreads are tightest.
Gold is not a guaranteed safe haven. In Q1 2026, gold fell sharply from $5,595 toward $4,000 as Middle East conflict drove oil above $100 per barrel, pushing bond yields and the US Dollar higher. Safe-haven demand was overwhelmed by real yield and currency dynamics.
Why Is Gold Called a Safe Haven Asset? The 2026 Reality

Gold has been the world's primary store of value for more than 5,000 years. Unlike government bonds, corporate equities, or fiat currencies, physical gold carries no counterparty risk — it is no one's liability. This property makes it uniquely attractive during periods of systemic financial stress, when the solvency of other asset classes becomes uncertain.
The structural case for gold in 2026 is unusually strong. Global central banks purchased 863 tonnes in 2025 (World Gold Council data) — the third consecutive year of purchases above 500 tonnes. China's People's Bank continued adding to reserves throughout H1 2026 alone, bringing total reserves to over 2,300 tonnes. Poland and Kazakhstan were also active purchasers. This sustained institutional demand signals that the world's most sophisticated reserve managers view gold as a strategic necessity, not merely a speculative asset.
However, the 2026 price action delivered a critical lesson: gold's safe-haven status has limits. When Middle East conflict escalated in February–March 2026, oil surged above $100 per barrel. This triggered inflation concerns that pushed bond yields sharply higher, lifting real interest rates and strengthening the US Dollar. This combination — rising real yields and a stronger Dollar — overwhelmed safe-haven demand and caused gold to correct more than 28% from its January all-time high. Gold is a safe haven most of the time, but macro forces — particularly real yields and the Dollar — can and do override it.
The practical implication for traders: never treat gold as a one-directional safe-haven trade without monitoring real yields and Dollar strength simultaneously. The safe-haven narrative can reverse in days when the macro environment shifts.
How Does the US Dollar Affect Gold Prices?

Gold is priced globally in US Dollars. This creates a well-documented and highly reliable inverse correlation: when the Dollar strengthens, gold becomes more expensive for holders of other currencies, reducing global demand and pushing the Dollar price lower. When the Dollar weakens, gold becomes cheaper internationally, stimulating demand and supporting the price.
The US Dollar Index (DXY) — which measures the Dollar against a basket of six major currencies — is the single most important macro chart to monitor alongside XAU/USD. Professional gold traders typically check DXY before analysing the gold chart itself. When DXY is in a downtrend or showing distribution at resistance, structural tailwinds for gold are building. When DXY is in an uptrend or breaking above resistance, gold faces structural headwinds regardless of geopolitical sentiment.
The 2026 price action illustrates this precisely. In January, the Dollar softened materially as markets priced in an accelerated Federal Reserve rate-cutting cycle — the primary catalyst for gold's move to its all-time high of $5,595.47 on 29 January. When inflation concerns re-emerged in Q2 and the Dollar subsequently recovered, gold retraced toward $4,000, even though underlying geopolitical tensions that had initially supported the rally remained in place.
Key insight for 2026: do not trade gold in isolation from DXY. A technically bullish gold chart that is fighting against a strongly rising Dollar is a low-probability trade. Confluence between a technically weak Dollar and a technically strong gold chart produces the highest-probability setups.
How Do Interest Rates and the Fed Drive Gold Prices?
The relationship between gold and interest rates operates through a concept called real interest rates — the nominal interest rate minus the inflation rate. Gold pays no yield. When real yields are positive, bonds and cash become more attractive relative to gold, increasing the opportunity cost of holding gold and typically pushing its price lower. When real yields are negative or falling, gold becomes comparatively more attractive.
In 2026, the Federal Reserve began cutting rates from the 2023–2024 peak levels, reducing real yields and providing the primary structural support for gold's move to new all-time highs. Critically, it is the market's expectations of the pace and depth of the Fed cutting cycle — not the cuts themselves — that drive the most significant gold price moves. Gold frequently rallies in advance of expected rate cuts and corrects when those expectations are revised downward.
Watch the FOMC calendar: Federal Open Market Committee meetings occur approximately every six weeks. The release of the meeting statement, the updated "dot plot" of rate projections, and particularly the Chair's press conference are the highest-impact scheduled events for gold traders. In 2026, unexpected hawkish pivots at FOMC meetings triggered some of the sharpest single-session declines in XAU/USD — declines of $80–$120 per ounce in a matter of hours.
Gold traders who focus exclusively on technical analysis and ignore the interest rate cycle are missing the most important input into their analysis. Before entering any gold trade with a multi-day holding period, always establish your view on: (1) the current direction of real US yields, and (2) whether the next FOMC meeting is likely to be hawkish or dovish relative to market expectations.
How to Trade Gold CFDs: Methods, Brokers, and Verified Spread Data
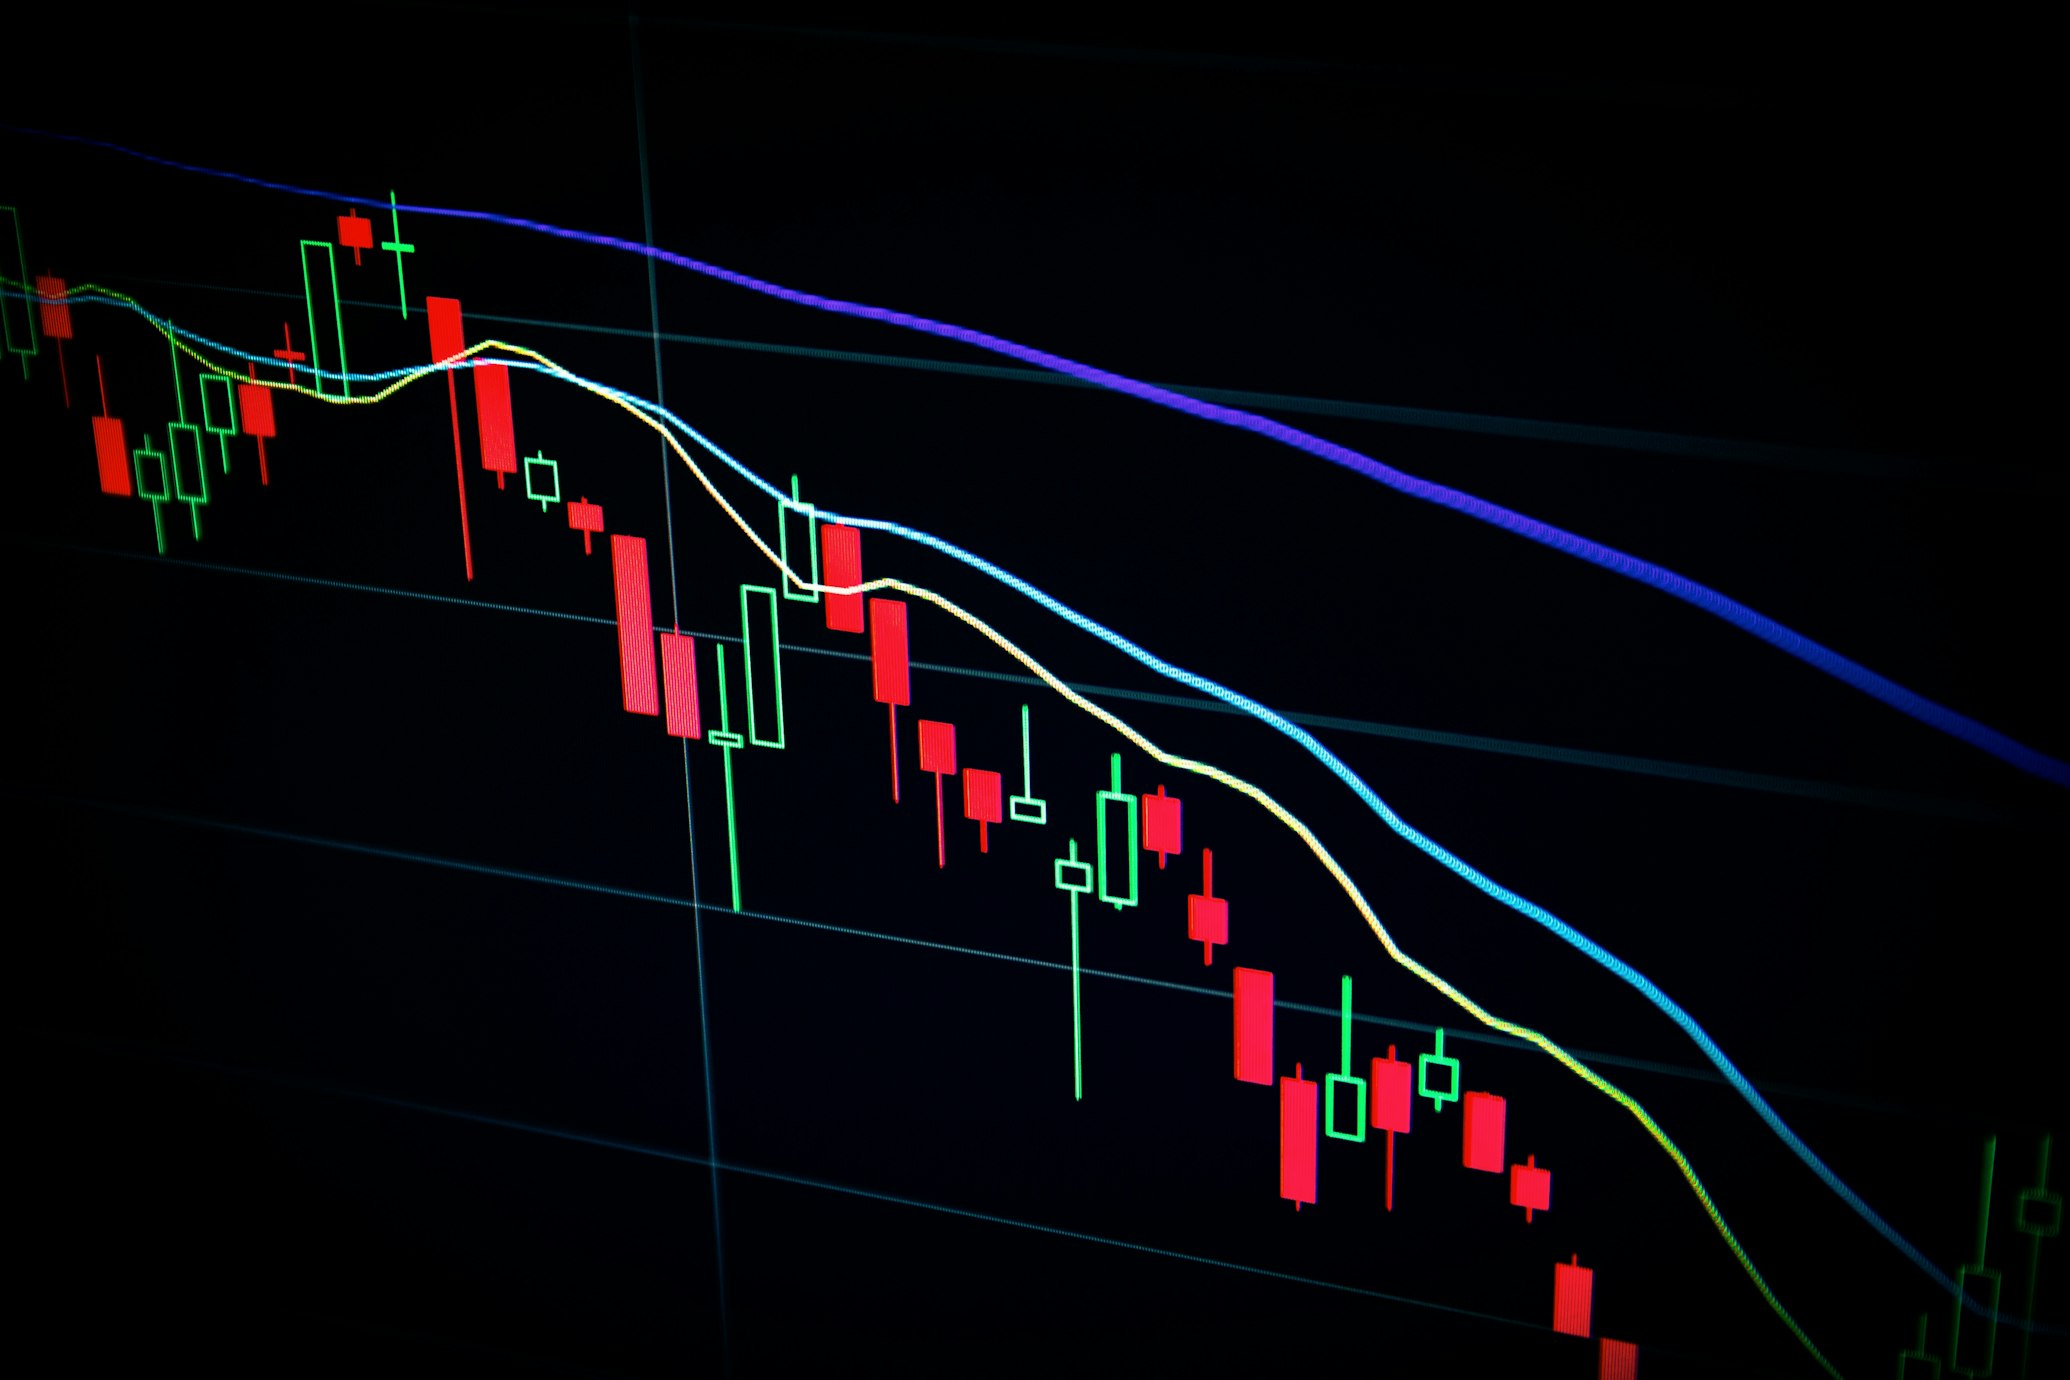
There are four primary ways retail traders access gold price exposure in 2026. Each has different cost structures, risk profiles, and use cases.
Comparison of Gold Trading Methods in 2026:
| Method | Own Gold? | Leverage | Typical Cost | Best For |
|---|---|---|---|---|
| Gold CFD (XAU/USD) | No | Up to 1:20 retail | $0.03–$0.45/oz spread | Active traders |
| Gold ETF (e.g. GLD, SGOL) | Indirect | None (unlevered) | 0.10–0.25% annual TER | Long-term investors |
| Physical Gold | Yes | None | 1–5% dealer premium + storage | Long-term wealth storage |
| Gold Mining Stocks | No | None (or margin) | Standard equity spread | Leveraged gold beta |
For active traders, Gold CFDs (XAU/USD) are the most practical method. They require no physical storage, allow positions in both directions (long and short), are available on standard forex broker platforms (MT4, MT5, cTrader), and offer fractional position sizing unavailable in futures markets.
ForexRater's 2026 XAU/USD Spread Data (Verified):
| Broker | Account Type | Avg XAU/USD Spread | Commission |
|---|---|---|---|
| IC Markets | Raw Trader | $0.03 | $3.50/lot |
| Pepperstone | Razor | $0.10 | $3.50/lot |
| FP Markets | Raw | $0.15 | $3.00/lot |
| Fusion Markets | Zero | $0.18 | $2.25/lot |
| Capital.com | Standard | $0.20 | None |
| AvaTrade | Standard | $0.29 | None |
| XM | Ultra Low | $0.32 | None |
| IG Group | Standard | $0.45 | None |
Spread data collected during London session normal market conditions, July 2026. Spreads widen materially during low-liquidity periods and around major data releases.
What Is the Best Time to Trade Gold (XAU/USD)?
Gold trades 23 hours per day on weekdays (closing briefly between 22:00 and 23:00 GMT). However, not all hours are equal. Liquidity, spread width, and price reliability vary dramatically across sessions. Here are the four trading windows ranked by liquidity:
1. COMEX/New York Overlap (13:20–18:00 GMT) — Highest Liquidity. COMEX gold futures are the world's primary price discovery mechanism for gold. When COMEX opens at 13:20 GMT, institutional order flow surges and spreads tighten to their minimum. The overlap with London's afternoon session creates the deepest liquidity of the trading day. This is the optimal window for executing larger orders and for trading around US economic data releases (CPI, NFP, FOMC). The highest-impact gold price moves of 2026 have almost all occurred during this window.
2. London Session (08:00–17:00 GMT) — Strong Liquidity. London is the world's largest OTC gold trading hub and home to the twice-daily LBMA Gold Price benchmark fixing (10:30 AM and 3:00 PM London time). The morning London session sees strong institutional participation and is particularly sensitive to European economic data and geopolitical developments. The LBMA fixing times are moments of concentrated institutional activity worth monitoring.
3. Asian Session (00:00–08:00 GMT) — Moderate Liquidity. The Shanghai Gold Exchange (SGE) trades during 01:00–07:00 GMT, providing meaningful liquidity. However, spreads are typically 30–60% wider than during COMEX hours. Notably, the World Gold Council's mid-year 2026 analysis found that gold's rebounds from intraday lows "generally occurred during Asian hours," while US-session activity was more likely to produce directional breaks and sustained moves.
4. Avoid — Friday Close and Weekend Open (21:00 GMT Friday – 23:00 GMT Sunday). This is the lowest-liquidity period of the week. Spreads widen significantly, Monday opening gaps are frequent, and there is no institutional price discovery to validate moves. Professional gold traders do not open new positions during this window unless reacting to a specific, confirmed weekend news event.
Technical Analysis of Gold: Key Levels and Patterns in 2026
Interactive Component: indicator crossover Logic
Gold respects technical levels with unusual consistency — more so than most major currency pairs. This is because the same technical tools (50-day MA, 200-day MA, round-number psychological levels) are monitored by an enormous, globally distributed community of participants who react to the same price action simultaneously, creating self-fulfilling technical boundaries.
The 2026 Key Levels (as of July 2026):
$5,595 — All-Time High (29 January 2026): The January intraday high is the major overhead resistance for any future rally. A decisive daily close above this level would be a historically significant breakout and would likely attract substantial institutional buying.
$5,000 — Major Psychological Resistance: Round-number levels act as magnets for stop clusters and institutional orders. The $5,000 level was breached on the way up in January and will serve as significant resistance on any recovery attempt. Expect sharp two-way price action around this level.
$4,000 — Major Psychological Support: Gold tested and held the $4,000 level in June 2026, establishing it as the key medium-term support. A weekly close below $4,000 on high volume would be a meaningful bearish signal suggesting further correction toward the 2025 breakout range around $3,200–$3,500.
The 200-Day Moving Average — Primary Trend Filter: Professional gold traders universally watch the 200-day moving average as the primary trend indicator. Gold trading above its 200-DMA is in a confirmed long-term uptrend; below it signals potential trend reversal. Check this level weekly before forming a directional bias.
The Golden Cross and Death Cross: When the 50-day MA crosses above the 200-day MA (a Golden Cross), it signals a potential long-term bullish trend acceleration — historically one of the most reliable signals in precious metals markets. The Death Cross (50-day crossing below 200-day) signals potential extended weakness. Both signals are lagging by nature and should be used for trend confirmation rather than entry timing.
RSI Divergence — The Reliable Reversal Signal: Gold's RSI can remain above 70 (overbought) for extended periods during strong trends — as it did from late 2025 into January 2026. Using RSI overbought readings alone to call a reversal is dangerous in gold. The more reliable signal is RSI divergence — when price makes a new high but RSI does not confirm it. This divergence appeared clearly in late January 2026 before the major correction, providing an early warning signal for technically focused traders.
What Are the Biggest Risks of Trading Gold CFDs?

Gold is frequently marketed to retail traders as a "safe" asset. This characterisation is misleading when applied to leveraged CFD trading. Gold CFDs carry specific risks that must be understood before taking any position.
Risk 1 — Leverage amplifies gold's already extreme volatility. Gold's 30-day realised volatility in H1 2026 was among the highest on record (World Gold Council). At 1:20 leverage, a 5% adverse move in gold — which occurred multiple times in 2026 — produces a 100% loss of deposited margin. The FCA and ASIC cap gold CFD leverage at 1:20 for retail clients precisely because of this amplification effect.
Risk 2 — Weekend gap risk is unusually high in gold. Gold is particularly susceptible to weekend gaps. Geopolitical events occurring between Friday's close and Sunday's open can cause gold to reopen significantly above or below its close, bypassing stop-loss orders. In January 2026, gold gapped more than $200 on the Sunday open following a surprise geopolitical development, triggering short-position stops at levels far worse than set. If you hold gold positions over weekends, either reduce size significantly or use a guaranteed stop-loss.
Risk 3 — Overnight swap costs erode longer-term positions. Holding gold CFD positions overnight incurs a daily swap fee. For positions held for multiple weeks, these costs accumulate meaningfully. Always calculate the total cost of carry before holding gold positions beyond a few days, particularly in a high-interest-rate environment where swap charges are highest.
Risk 4 — The safe-haven paradox during inflation shocks. Gold underperforms expectations during inflation-driven rate hike cycles. Counterintuitively, high inflation can be negative for gold if it triggers central bank rate hikes that push real yields sharply higher. 2026 demonstrated this in Q1–Q2 when inflation concerns from the Middle East conflict pushed yields up and gold down over 28% from its peak.
Risk 5 — Spread costs compound for high-frequency traders. At a market-average spread of $0.32 per ounce on standard accounts, taking 10 gold positions per day costs $64 in spread before any adverse price movement. Over a 20-trading-day month, that is $1,280 in spread costs alone. For active traders, the choice of broker account (raw spread + commission vs standard spread, no commission) has a direct and measurable impact on profitability.
Risk Management Rules for Gold CFD Traders
Given gold's 2026 volatility profile — a range of approximately $1,636 between the January high of $5,595 and the June low near $3,959 — rigid risk management is non-negotiable. The following rules are drawn from institutional trading frameworks applied to retail CFD constraints.
Rule 1: Cap position risk at 1% of account per trade. Gold's volatility means that a well-placed stop-loss may still represent a large absolute move. A standard risk rule of 1% of total account equity per gold position limits the damage of any single adverse move. At 1:20 leverage, this typically means position sizes of 0.01–0.05 lots for accounts under $10,000.
Rule 2: Never move a stop-loss further away once set. The psychological pressure to "give the trade more room" is strongest in volatile assets like gold. Moving a stop wider after entry is how retail traders convert small losses into account-ending losses. Set your stop based on technical structure (below key support, above key resistance) before entry, and do not move it against you.
Rule 3: Reduce or close positions before weekends. If you must hold a gold position over the weekend, either reduce its size by at least 50% or use a guaranteed stop-loss. An unprotected full-size gold position without a stop over a geopolitical weekend is speculation, not trading. IG Group, Plus500, and select other brokers offer guaranteed stops for gold positions at a small additional premium.
Rule 4: Distinguish between gold's three types of price moves. Gold makes three distinct types of moves, each requiring different management: (a) Macro trend moves driven by Fed policy/Dollar/real yields — multi-day, directional; trade with the trend, hold for several sessions; (b) Geopolitical spikes triggered by sudden risk events — sharp, often reverting within 24–48 hours; do not chase these, wait for the spike to stabilise before positioning; (c) Technical breakouts from range-bound periods — highest-probability setups for trend entries with clearly defined invalidation levels. Confusing these move types — particularly chasing geopolitical spikes — is one of the most common and costly errors gold traders make.
Gold vs. Bitcoin in 2026: Which Should You Trade?

The "Gold vs Bitcoin" debate has evolved significantly in 2026. Rather than a binary choice, most sophisticated market participants now treat the two assets as serving different roles — with meaningfully different trading characteristics.
Gold's 2026 trading characteristics: Lower volatility relative to crypto, deeper OTC liquidity, well-understood macro drivers (Dollar, real yields, central bank demand), universally recognised by all global central banks and available on all regulated CFD broker platforms. Gold's 2026 range of approximately $3,959–$5,595 represented a 41% range — substantial by traditional asset standards, but tightly bounded compared to Bitcoin.
Bitcoin's 2026 trading characteristics: Higher volatility with intraday moves frequently exceeding 5–8%, true 24/7 market access including weekends, decentralised and less directly correlated with central bank policy cycles. Bitcoin's correlation to risk assets (particularly the Nasdaq) remained higher than gold's throughout 2026, making it a less effective pure hedge during equity market sell-offs — a role gold continued to fill more reliably.
The practical 2026 answer for traders: If your primary goal is to trade macro themes — Fed policy, geopolitical risk, dollar direction — gold provides cleaner, more data-driven setups. If your primary goal is maximum volatility and 24/7 market access, Bitcoin offers that with the trade-off of less predictable macro drivers. Many professional traders in 2026 maintain exposure to both: gold for macro-driven, higher-conviction multi-day trades; Bitcoin for shorter-term momentum and weekend positioning.
How to Trade Gold (XAU/USD) in 2026 — The Complete Guide Quiz
Test your understanding of the concepts covered in this masterclass.
1.What was gold's all-time high price in 2026, and when did it occur?
2.How many tonnes of gold did global central banks purchase in 2025, according to the World Gold Council?
3.What is the typical XAU/USD spread at IC Markets on a Raw Trader account, according to verified 2026 data?
4.What is the primary relationship between the US Dollar and gold prices?
5.What is the maximum retail leverage allowed on gold CFDs under FCA and ASIC regulation?
📖 Key Terms — Forex Glossary
Not sure about a term?Browse our full Forex Glossary →
Frequently Asked Questions
Expert Answers to Common Queries